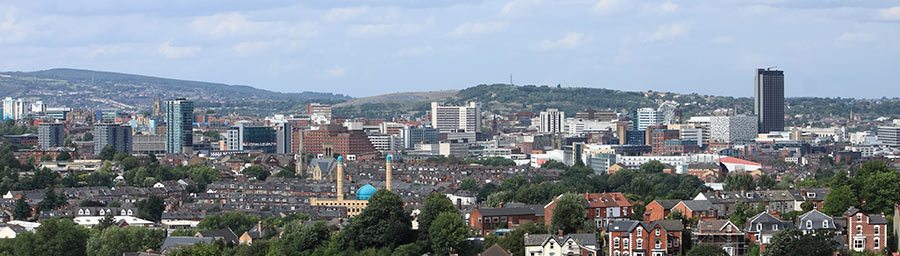
The next housing bubble: Some previously hot markets, such as Liverpool and Sheffield, may start cooling down.
House prices in no fewer than 19 towns and cities, such as Liverpool, Sheffield and Newcastle Upon Tyne, are now considered to be potentially overvalued, according to new research.
Despite the general housing market slowdown, some parts of the UK have seen significant home price gains of late, but there are growing fears that values in some of those towns and cities are overheating.
To determine if a market is overvalued, UK-wide mortgage broker One 77 Mortgages compares current property prices to their long-run and sustainable levels, which are supported by mortgage lending.
An overvalued market is one in which home prices are increasing at what is considered to be an unsustainable rate, while the level of mortgage borrowing to acquire property in the local area is falling.
The idea is that while demand drives sentiment, placing upward pressure on house prices, ultimately most people need to borrow in order to raise the funds required to buy property.
But if mortgage lending takes a different trajectory to property prices in a particular area, the likelihood is that house price growth will eventually run out of steam.
Interestingly, there are only four towns or cities in the south of England that are deemed to be in ‘bubble’ territory, with most areas identified as potentially having overpriced properties primarily located up north.
The analysis reveals that Cleveland is the most vulnerable place to face an affordability crunch, followed by Blackburn and Blackpool in second and third paces respectively.
Truro, Torquay, Plymouth and Dorchester are the only southern areas to feature.
| Area | Annual Change in lending | Annual Drop in Lending | Annual House Price Change | % Gap |
| Cleveland | -0.9% | £53,589,511 | 11.0% | 11.9% |
| Blackburn | -0.6% | £27,761,009 | 6.2% | 6.8% |
| Blackpool | -1.2% | £36,189,774 | 5.0% | 6.2% |
| Torquay | -0.6% | £24,541,823 | 5.0% | 5.6% |
| Bolton | -0.1% | £4,709,553 | 5.2% | 5.3% |
| Plymouth | -0.3% | £21,373,711 | 4.5% | 4.8% |
| Bradford | -1.0% | £57,588,683 | 3.7% | 4.7% |
| Liverpool | -0.2% | £19,030,886 | 4.5% | 4.7% |
| Dorchester | -0.7% | £19,963,937 | 3.5% | 4.2% |
| Harrogate | -0.3% | £7,001,238 | 3.7% | 4.0% |
| Darlington | -1.4% | £45,969,751 | 2.6% | 4.0% |
| Carlisle | -0.5% | £10,849,257 | 3.4% | 3.9% |
| Doncaster | -0.7% | £49,802,527 | 2.8% | 3.5% |
| Sheffield | -0.1% | £16,076,849 | 2.7% | 2.8% |
| Huddersfield | -1.1% | £31,045,436 | 1.6% | 2.7% |
| Sunderland | -1.4% | £27,565,238 | 1.0% | 2.4% |
| Hereford | -0.6% | £12,379,549 | 1.6% | 2.2% |
| Newcastle upon Tyne | -0.7% | £76,875,551 | 1.0% | 1.7% |
| Truro | -0.2% | £7,329,788 | 1.2% | 1.4% |

Source: UK Finance Q1 2017 postcode areas compared with local authority UK HPI March 2017 vs March 2016.